The Tweet:
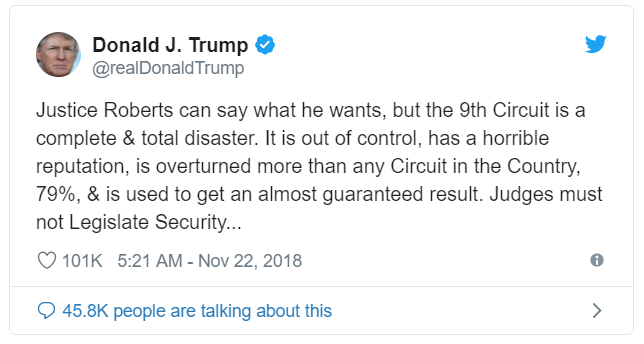
This tweet unleashed a tempest in a teapot, with a host of inane "fact checks." The purpose of this article is to show that
everybody was wrong and nobody asked the right question in the first place.
But first, we'll look at the questions they asked.
Is the 9th circuit "the most reversed?" If you are talking about number of reversals, the answer is yes, since the 9th circuit has a lot more cases than any other circuit, and would need to have a ridiculously low reversal rate for that NOT to be true. It is indeed the most reversed circuit. But it is also the most affirmed circuit:
Is the 9th circuit "the most reversed?" If you are talking about number of reversals, the answer is yes, since the 9th circuit has a lot more cases than any other circuit, and would need to have a ridiculously low reversal rate for that NOT to be true. It is indeed the most reversed circuit. But it is also the most affirmed circuit:
|
"Yes," said Sancho, "but I have heard say that there are more friars in heaven than knights-errant."
"That," said Don Quixote, "is because those in religious orders are more numerous than knights." — Miguel de Cervantes, Don Quixote, Vol. II Ch. VIII |
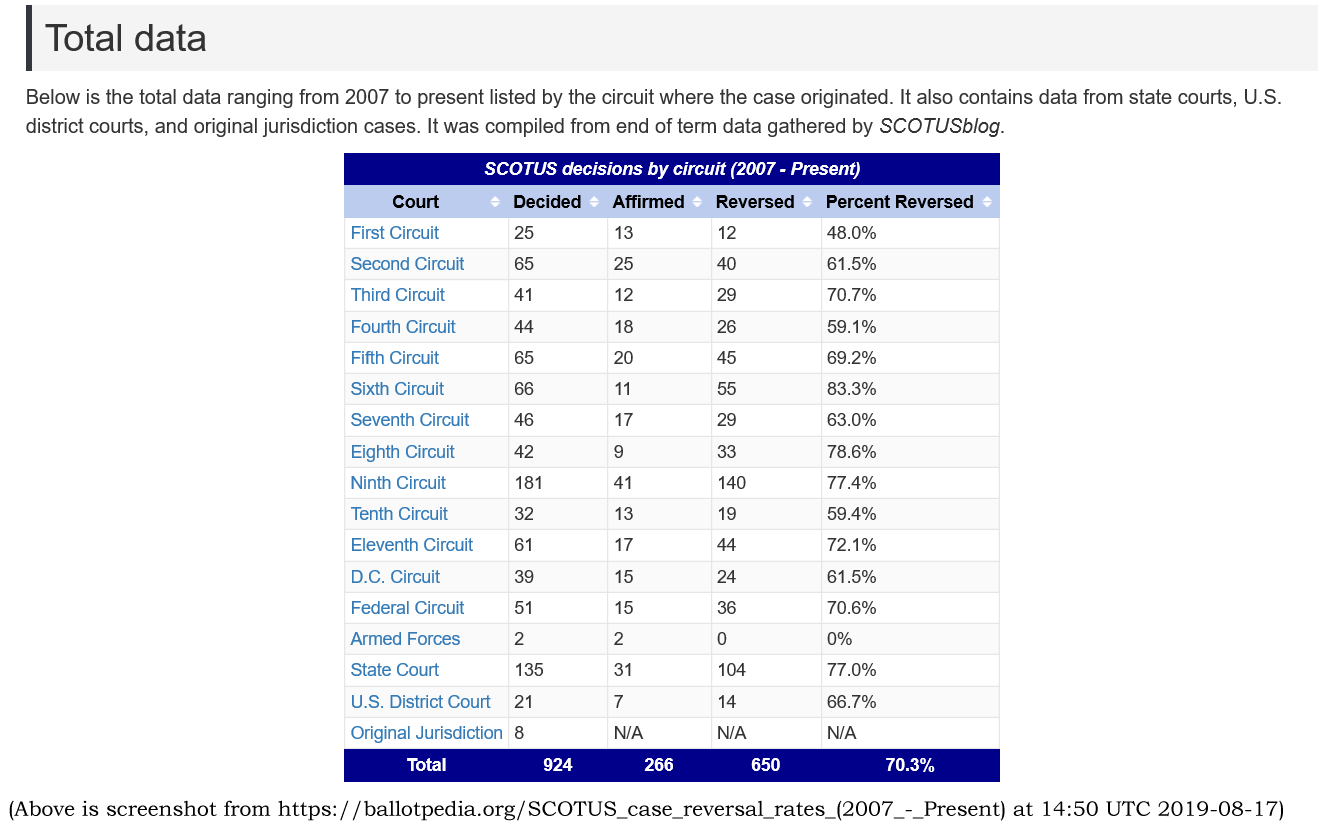
| Court | Total Cases | Affirmed | Reversed | % Reversed |
|---|---|---|---|---|
| First Circuit | 25 | 13 | 12 | 48.00% |
| Fourth Circuit | 44 | 18 | 26 | 59.09% |
| Tenth Circuit | 32 | 13 | 19 | 59.38% |
| Second Circuit | 65 | 25 | 40 | 61.54% |
| D.C. Circuit | 39 | 15 | 24 | 61.54% |
| Seventh Circuit | 46 | 17 | 29 | 63.04% |
| U.S. District Court | 21 | 7 | 14 | 66.67% |
| Fifth Circuit | 65 | 20 | 45 | 69.23% |
| Federal Circuit | 51 | 15 | 36 | 70.59% |
| Third Circuit | 41 | 12 | 29 | 70.73% |
| Eleventh Circuit | 61 | 17 | 44 | 72.13% |
| State Court | 135 | 31 | 104 | 77.04% |
| Ninth Circuit | 181 | 41 | 140 | 77.35% |
| Eighth Circuit | 42 | 9 | 33 | 78.57% |
| Sixth Circuit | 66 | 11 | 55 | 83.33% |
| *****TOTAL | 914 | 264 | 650 | 71.12% |
| For a cheap thrill, click a circuit name in the table above to see the binomial distribution of probabilities for various numbers of reversals, given the circuit's total cases and reversal probability of % Reversed. When looking at the calculator output, remember that "successes" means "reversals." | ||||

After Trump apologists had finished observing that the 9th Circuit is indeed the most reversed (but without observing that it is also the most affirmed), a horde of "fact checkers" began observing that the 9th Circuit reversal percentages were below this or that other circuit. Using observations from cherry-picked periods of time was a favorite. Some even looked at individual terms, as if reversal percentages based on tiny numbers of cases are even worth talking about. They slavered and barked over trivial differences in percentages, apparently unaware that, probability theory aside, dividing up an integer number of reversals among circuits as fairly as possible will almost invariably result in differing reversal percentages (a fact discussed in the notes section below). Yes, it was THAT bad.
Confidence intervals
So can we say say with confidence that any circuit's reversal percentage differs by more than chance from any other's? Good question! We'll estimate the standard error of the reversal percentage for each circuit from its total cases and number of reversals, then estimate confidence intervals for each circuit's reversal percentage.Doing this, we can see that confidence intervals do not overlap for the First Circuit and apparent miscreants like the 6th, 9th, and State Courts, indicating that the First Circuit's reversal percentage differs significantly from theirs. We also see that many confidence intervals overlap. In particular, the overlap of the 6th, 8th, 9th, and State Courts is very strong. This might suggest that babbling about the difference in reversal rates for these courts is a waste of time.

<Digression> While non-overlapping confidence intervals imply statistical significance, overlapping confidence intervals do not necessarily imply a lack of statistical significance. Not that it matters, since we will be testing for this next. The width of the confidence interval decreases as sample size (number of cases in the circuit) increases, and as the reversal percentage varies from 50%, which is where the standard error of a proportion for any given sample size has its maximum. Thus, the Ninth Circuit has the narrowest confidence interval, and the First Circuit and U.S. District Court, the widest. <End Digression>
An Exercise in Data Dredging
All well and good, but what we really want to know is: what is the probability that the difference in reversal rates between Circuit A and Circuit B is due to chance? We can compute this value for all 105 (15 choose 2) pairs of circuits, and get this interesting table, with the p values for the 105 pairs shown below the main diagonal of 1's:| First Circuit | 1.00000 | ||||||||||||||
|---|---|---|---|---|---|---|---|---|---|---|---|---|---|---|---|
| Second Circuit | 0.24413 | 1.00000 | |||||||||||||
| Third Circuit | 0.06479 | 0.33352 | 1.00000 | ||||||||||||
| Fourth Circuit | 0.37333 | 0.79755 | 0.26178 | 1.00000 | |||||||||||
| Fifth Circuit | 0.06120 | 0.35664 | 0.86978 | 0.27573 | 1.00000 | ||||||||||
| Sixth Circuit | 0.00064 | 0.00521 | 0.12291 | 0.00470 | 0.05759 | 1.00000 | |||||||||
| Seventh Circuit | 0.22032 | 0.87205 | 0.44764 | 0.70061 | 0.49574 | 0.01470 | 1.00000 | ||||||||
| Eighth Circuit | 0.00996 | 0.06463 | 0.41142 | 0.05168 | 0.28848 | 0.53456 | 0.11078 | 1.00000 | |||||||
| Ninth Circuit | 0.00176 | 0.01360 | 0.36955 | 0.01353 | 0.19362 | 0.30726 | 0.04700 | 0.86402 | 1.00000 | ||||||
| Tenth Circuit | 0.39222 | 0.83739 | 0.31030 | 0.98015 | 0.33540 | 0.00970 | 0.74324 | 0.07347 | 0.03121 | 1.00000 | |||||
| Eleventh Circuit | 0.03300 | 0.20748 | 0.87791 | 0.16194 | 0.72091 | 0.12816 | 0.31755 | 0.45966 | 0.40910 | 0.21124 | 1.00000 | ||||
| D.C. Circuit | 0.28679 | 1.00000 | 0.38474 | 0.82011 | 0.42156 | 0.01242 | 0.88652 | 0.09346 | 0.03980 | 0.85276 | 0.26804 | 1.00000 | |||
| Federal Circuit | 0.05511 | 0.30876 | 0.98802 | 0.24056 | 0.87438 | 0.10011 | 0.43002 | 0.38126 | 0.31903 | 0.29296 | 0.85715 | 0.36680 | 1.00000 | ||
| State Court | 0.00282 | 0.02223 | 0.41055 | 0.02042 | 0.23549 | 0.30250 | 0.06334 | 0.83551 | 0.94801 | 0.04143 | 0.45962 | 0.05321 | 0.36315 | 1.00000 | |
| U.S. District Court | 0.20334 | 0.67253 | 0.74247 | 0.55713 | 0.82578 | 0.10055 | 0.77417 | 0.30615 | 0.27633 | 0.59220 | 0.63501 | 0.69419 | 0.74265 | 0.30305 | 1.00000 |
| First Circuit | Second Circuit | Third Circuit | Fourth Circuit | Fifth Circuit | Sixth Circuit | Seventh Circuit | Eighth Circuit | Ninth Circuit | Tenth Circuit | Eleventh Circuit | D.C. Circuit | Federal Circuit | State Court | U.S. District Court |
Which pretty much confirms that all that yammering over who has the worst reversal rate was a waste of time. The probability that the Ninth Circuit's reversal rate differs by chance alone from the 6th, 8th, and State Courts is 30%, 86%, and 95%, respectively.
But the table above is hard to read. We would more likely just want to see the 105 pairs sorted in descending or ascending order by p value, which is a lot easier to digest. (Which court is denominated Court A or Court B in the pair is arbitrary; order is irrelevant.)
| Court A | Court B | p value |
|---|---|---|
| First Circuit | Sixth Circuit | 0.00064 |
| First Circuit | Ninth Circuit | 0.00176 |
| First Circuit | State Court | 0.00282 |
| Fourth Circuit | Sixth Circuit | 0.00470 |
| Second Circuit | Sixth Circuit | 0.00521 |
| Sixth Circuit | Tenth Circuit | 0.00970 |
| First Circuit | Eighth Circuit | 0.00996 |
| Sixth Circuit | D.C. Circuit | 0.01242 |
| Fourth Circuit | Ninth Circuit | 0.01353 |
| Second Circuit | Ninth Circuit | 0.01360 |
| Sixth Circuit | Seventh Circuit | 0.01470 |
| Fourth Circuit | State Court | 0.02042 |
| Second Circuit | State Court | 0.02223 |
| Ninth Circuit | Tenth Circuit | 0.03121 |
| First Circuit | Eleventh Circuit | 0.03300 |
| Ninth Circuit | D.C. Circuit | 0.03980 |
| Tenth Circuit | State Court | 0.04143 |
| Seventh Circuit | Ninth Circuit | 0.04700 |
| Fourth Circuit | Eighth Circuit | 0.05168 |
| D.C. Circuit | State Court | 0.05321 |
| First Circuit | Federal Circuit | 0.05511 |
| Fifth Circuit | Sixth Circuit | 0.05759 |
| First Circuit | Fifth Circuit | 0.06120 |
| Seventh Circuit | State Court | 0.06334 |
| Second Circuit | Eighth Circuit | 0.06463 |
| First Circuit | Third Circuit | 0.06479 |
| Eighth Circuit | Tenth Circuit | 0.07347 |
| Eighth Circuit | D.C. Circuit | 0.09346 |
| Sixth Circuit | Federal Circuit | 0.10011 |
| Sixth Circuit | U.S. District Court | 0.10055 |
| Seventh Circuit | Eighth Circuit | 0.11078 |
| Third Circuit | Sixth Circuit | 0.12291 |
| Sixth Circuit | Eleventh Circuit | 0.12816 |
| Fourth Circuit | Eleventh Circuit | 0.16194 |
| Fifth Circuit | Ninth Circuit | 0.19362 |
| First Circuit | U.S. District Court | 0.20334 |
| Second Circuit | Eleventh Circuit | 0.20748 |
| Tenth Circuit | Eleventh Circuit | 0.21124 |
| First Circuit | Seventh Circuit | 0.22032 |
| Fifth Circuit | State Court | 0.23549 |
| Fourth Circuit | Federal Circuit | 0.24056 |
| First Circuit | Second Circuit | 0.24413 |
| Third Circuit | Fourth Circuit | 0.26178 |
| Eleventh Circuit | D.C. Circuit | 0.26804 |
| Fourth Circuit | Fifth Circuit | 0.27573 |
| Ninth Circuit | U.S. District Court | 0.27633 |
| First Circuit | D.C. Circuit | 0.28679 |
| Fifth Circuit | Eighth Circuit | 0.28848 |
| Tenth Circuit | Federal Circuit | 0.29296 |
| Sixth Circuit | State Court | 0.30250 |
| State Court | U.S. District Court | 0.30305 |
| Eighth Circuit | U.S. District Court | 0.30615 |
| Sixth Circuit | Ninth Circuit | 0.30726 |
| Second Circuit | Federal Circuit | 0.30876 |
| Third Circuit | Tenth Circuit | 0.31030 |
| Seventh Circuit | Eleventh Circuit | 0.31755 |
| Ninth Circuit | Federal Circuit | 0.31903 |
| Second Circuit | Third Circuit | 0.33352 |
| Fifth Circuit | Tenth Circuit | 0.33540 |
| Second Circuit | Fifth Circuit | 0.35664 |
| Federal Circuit | State Court | 0.36315 |
| D.C. Circuit | Federal Circuit | 0.36680 |
| Third Circuit | Ninth Circuit | 0.36955 |
| First Circuit | Fourth Circuit | 0.37333 |
| Eighth Circuit | Federal Circuit | 0.38126 |
| Third Circuit | D.C. Circuit | 0.38474 |
| First Circuit | Tenth Circuit | 0.39222 |
| Ninth Circuit | Eleventh Circuit | 0.40910 |
| Third Circuit | State Court | 0.41055 |
| Third Circuit | Eighth Circuit | 0.41142 |
| Fifth Circuit | D.C. Circuit | 0.42156 |
| Seventh Circuit | Federal Circuit | 0.43002 |
| Third Circuit | Seventh Circuit | 0.44764 |
| Eleventh Circuit | State Court | 0.45962 |
| Eighth Circuit | Eleventh Circuit | 0.45966 |
| Fifth Circuit | Seventh Circuit | 0.49574 |
| Sixth Circuit | Eighth Circuit | 0.53456 |
| Fourth Circuit | U.S. District Court | 0.55713 |
| Tenth Circuit | U.S. District Court | 0.59220 |
| Eleventh Circuit | U.S. District Court | 0.63501 |
| Second Circuit | U.S. District Court | 0.67253 |
| D.C. Circuit | U.S. District Court | 0.69419 |
| Fourth Circuit | Seventh Circuit | 0.70061 |
| Fifth Circuit | Eleventh Circuit | 0.72091 |
| Third Circuit | U.S. District Court | 0.74247 |
| Federal Circuit | U.S. District Court | 0.74265 |
| Seventh Circuit | Tenth Circuit | 0.74324 |
| Seventh Circuit | U.S. District Court | 0.77417 |
| Second Circuit | Fourth Circuit | 0.79755 |
| Fourth Circuit | D.C. Circuit | 0.82011 |
| Fifth Circuit | U.S. District Court | 0.82578 |
| Eighth Circuit | State Court | 0.83551 |
| Second Circuit | Tenth Circuit | 0.83739 |
| Tenth Circuit | D.C. Circuit | 0.85276 |
| Eleventh Circuit | Federal Circuit | 0.85715 |
| Eighth Circuit | Ninth Circuit | 0.86402 |
| Third Circuit | Fifth Circuit | 0.86978 |
| Second Circuit | Seventh Circuit | 0.87205 |
| Fifth Circuit | Federal Circuit | 0.87438 |
| Third Circuit | Eleventh Circuit | 0.87791 |
| Seventh Circuit | D.C. Circuit | 0.88652 |
| Ninth Circuit | State Court | 0.94801 |
| Fourth Circuit | Tenth Circuit | 0.98015 |
| Third Circuit | Federal Circuit | 0.98802 |
| Second Circuit | D.C. Circuit | 1.00000 |
Some pretty low p values there, well below .05. But there is a problem. We tested 105 hypotheses. With that many tests, you would naturally expect some, say about five, to turn up significant at the .05 level, by chance.
There are many ways to adjust for this. We will use the Benjamini-Hochberg procedure. This allows us to specify a percentage of false "discoveries" that we are willing to tolerate. Setting this level to 10% makes the first three tests (First Circuit versus Sixth Circuit, Ninth Circuit, and State Courts) significant. These are highlighted in violet. Setting the tolerable false discovery level to 20% adds another ten, through Second Circuit - State Court, at a p value of .02223. These are highlighted in lavender.
Conclusions
- The reversal rates of the Sixth, Eighth, and Ninth Circuits, and State Courts, do not differ at any reasonable
level of significance. The difference in their reversal rates could easily be due to chance and is not worth talking about,
unless you need to write an article about it.
- The Sixth Circuit is implicated in six of the significant effects, the Ninth Circuit in three, State Courts in three,
and the Eighth Circuit in one. For whatever reason, the Sixth and Ninth Circuits, and State Courts, seem to have high reversal rates.
- Conversely, the First Circuit is implicated in four significant effects, the Second and Fourth Circuits are each implicated in three,
and the D.C., Seventh and Tenth Circuits each implicated in one. For whatever reason, the First, Second, and Fourth Circuits seem
to have low reversal rates.
Why it all means nothing
The major premise in the teapot tempest seemed to be, "If a circuit has a high reversal rate, it is lazy, stupid, biased, or feckless, and must have a high error rate in its decisions." Or something like that.The problem is that the reversal rates do not tell us much of anything, other than that the Supreme Court is more likely to reverse than affirm. Given that the main role of an appellate court is to correct errors, this is unsurprising.
The Supreme Court gets about 8,000 petitions for certiorari each year, and hears about 80 of them. Petitions for certiorari are not a random sample of cases. And the Supreme Court does not randomly sample petitions for certiorari. It does a purposive sample based on criteria that may fluctuate over time. If petitions for certiorari were a random sample of cases, and the Supreme Court took a random sample from the petitions, then a circuit's reversal rate might indeed reflect its error rate in deciding cases.
While such randomization might tell you error rates by circuit, it would not allow you to use those error rates to compare the precision of legal reasoning between circuits. Since circuits differ notably in the types of cases they hear, some might be getting more difficult (and thus error-prone) cases than others. To correct for that, you would need to assign cases to circuits randomly from the entire pool of U.S. cases. Once you did all these randomizations, you could make inferences about each circuit's error rate, and use the error rates to compare the precision of legal reasoning between circuits.
But that grand experiment will never happen, so in the meantime, we can muck around with some logistic regressions and misinterpret them as implying causality.
How about dividing a circuit's reversals by the total number of cases it handles? People have tried that. It would put a lower bound on the circuit's overall error rate. Other than that, it would not tell you anything about the circuit's overall error rate, which might be much higher. It is analogous to estimating the overall manufacturing defect rate for widgets from a handful of hard cases presented to the chief widget inspector.
So the real question — how correctly does each circuit decide its cases? — remains unanswered. And that is the question people should care about.
"It's like Shakespeare. Sounds well enough, but it doesn't really mean anything."
— Bertie WoosterQuasi pannus menstruatae universae justitiae nostrae... — Isaiah 64:6 |
NOTES
Why variation in reversal rates is (nearly) unavoidable
Given the data, it is impossible to avoid some variation in reversal rates between circuits, even if we try to avoid it by apportioning reversals as closely as possible between them. The fourth-grade arithmetic reason for this is that the overall reversal percentage is computed as 650/914. You can reduce that to 325/457, but not further, because 457 is a prime number. You can only assign an integer number of reversals to each circuit. It is impossible to find an integer i such that i/(circuit number of cases) = 325/457 for any circuit, given the total number of cases in each. If you try to assign the integer that comes closest to solving this for each circuit, you will end up with something that looks like this:
State Courts, Federal Circuit, District Court
In the article we use the term "circuits" to refer collectively to all listed categories of court. It would probably be advisable to exclude State Courts, Federal Circuit, and District Court from the analysis and concentrate solely on roughly comparable federal circuit courts, but if we did that, people would complain bitterly about the exclusion. Besides, there is a lot of variation between circuits in the proportions of cases of different types, and going down such a rathole was not the purpose of this article. Actually, I'm not sure what the purpose was.A more interesting question
Frankly, viewing reversals as a binary variable is rather silly. It's one thing for a close decision of a lower court to be reversed by a close decision of the SCOTUS. Might be a matter on which reasonable minds could differ. It's quite another for a unanimous decision of a lower court to be unanimously reversed by the SCOTUS (as in R.A.V. v. City of St. Paul, 505 U.S. 377 [1992]). A more refined measure of disagreement between lower courts and the SCOTUS would be useful. I'm sure people have done that, but don't have a reference. Washington University's Supreme Court Database has a variable called "lcDisagreement," but the variable lacks sufficient detail to be of use in such an analysis.It would also be interesting to analyze whether slight changes in the composition of lower courts — circuit courts of appeal and state supreme courts — might radically alter reversal rates for those courts. You could construct something like a ROC curve for that.
"Affirmed in part, reversed in part" offers another rathole.
P value for comparison of proportions
More than one way to do this, with slightly different results in this case, but we ended up using the more common one. Not that it matters much one way or the other.Articles
A sampling of articles about this burning issue that concerns us all:https://www.nytimes.com/2018/11/26/us/politics/fact-check-trump-ninth-circuit.html
https://www.politifact.com/punditfact/statements/2017/feb/10/sean-hannity/no-9th-circuit-isnt-most-overturned-court-country-/
https://excessofdemocracy.com/blog/2017/2/politifact-fact-check-the-ninth-circuit-is-in-fact-the-most-reversed-federal-court-of-appeals
https://www.factcheck.org/2018/11/trump-misuses-data-in-9th-circuit-attack/
Data Source
Data was taken from the source shown below. "Original Jurisdiction" was excluded for obvious reasons (though the Supreme Court does occasionally reverse itself, so we could haggle about that.) "Armed Forces" was excluded because of the ridiculously small sample size.